Introduction
Measuring performance and tracking bugs is typically done inside a single web request or job. But what if you want to see the performance or flow of a web request together with all the jobs or additional requests it dispatches?
Open Telemetry, or OTel for short, is a collection of tools, APIs and SDKs to collect information on how an entire system is behaving. A "system" can be a single application, a group of applications that are working together (e.g. microservices) and even queued jobs across workers.
Using the laravel-open-telemetry package you can easily measure performance of a Laravel powered system. It can transmit the results to a tracing tool like Jaeger or Aspecto.
In your Laravel application, you can start and stop measurements using the Measure facade. You can nest measurements however deep you like and across multiple requests or jobs.
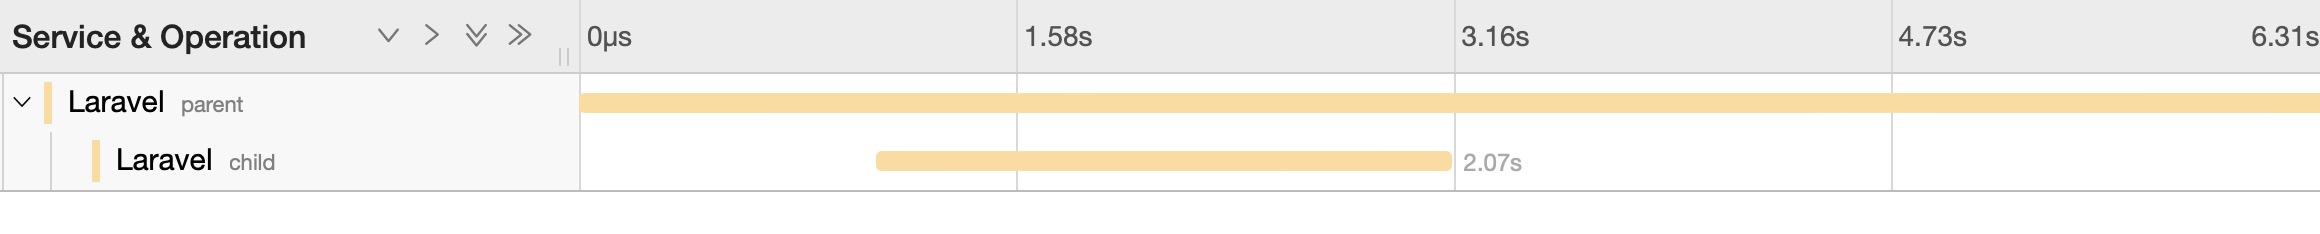
use Spatie\OpenTelemetry\Facades\Measure;

Measure::start('parent');
sleep(1);
Measure::start('child');

sleep(2);

Measure::stop('child');
sleep(3);
Measure::stop('parent');
Here's what that will look like in Jaeger:
The real value of this package comes when also using it to measure an entire process the includes the web requests, one or more jobs / services.
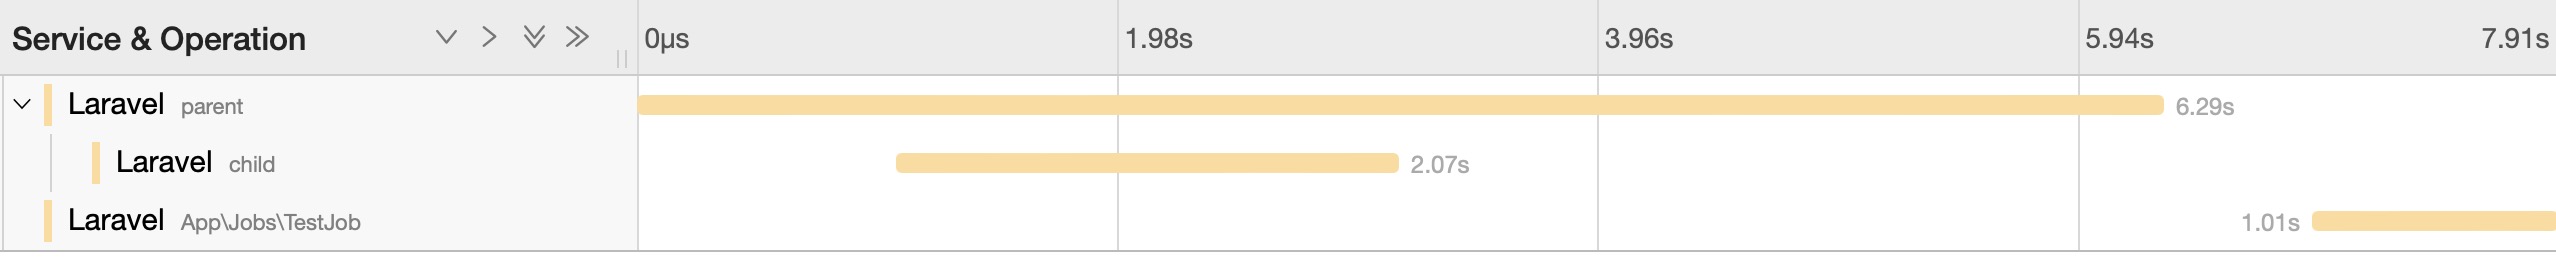
Measure::start('my-web-request');

Measure::stop('my-web-request');

dispatch(new MyJob()); // let's imagine that this jobs has a `sleep(1)` in its `handle` method.
The package will automatically measure any jobs. Any measurements in the job will be associated with the web request that dispatch it.
This is what it would look like in Jaeger:
Jaeger and similar tools can calculate averages and display very interesting statistics around the measurements made. This will greatly help you understand how your application performs as a whole.
This package isn't a full implementation of everything Open Telemetry has to offer. Its goal is to provide the easiest way to work with traces and span in a Laravel app.